Last week, Councillor Accursi, Councillor Papp, Town CAO Ottaway, and I attended the Association of Municipalities of Ontario (AMO) Conference in Ottawa. The annual three-day conference offered a range of learning sessions and networking opportunities for the more than 1,500 delegates.
While at AMO, your Pelham representatives also met with various Ministries to directly advanced your interests with the Provincial Government.
We met with Hon. Jeff Yurek, MPP, Minister of Natural Resources & Forestry (MNRF), and Toby Barrett, MPP, Parliamentary Assistant, about maintaining and increasing the protection of the Fonthill Kame. Over the last 10 years, we effectively used AMO and “Niagara Week” meetings to urge the Province to enhance the Area of Natural & Scientific Interest (ANSI) protections of the Kame. For the last few years we thanked the Provincial Government for finalizing those protections in late-2013. Now, we asked to work together with MRN Staff to add more of the Fonthill Kame to the protections offered by the Niagara Escarpment Plan.
We are delighted that Minister Yurek indicated that the Government would not be changing the ANSI protections! We look forward to working together on further safeguards.
We also met with Hon. Steve Clark, MPP, Minister of Municipal Affairs & Housing, about Provincial funding. We encouraged the government to fund municipal projects that help create wealth and prosperity for a community; we spoke not only about projects like downtown revitalizations but also community and cultural facilities like community centres and libraries. We also discouraged the government from investing in projects that create more sprawl – like urban boundary expansions or “smart centers” disconnected from community. Ministry Staff indicated that they could work with the Town on these issues.
The Minister also informed us about his planned review of Regional governments following this Fall’s municipal elections; we indicated that Niagara would definitely want to participate. This was consistent with his message earlier in the conference when he shared his focus in working with local governments: cut red tape, increase the housing supply, reduce unnecessary reporting, strengthen regional governments, and find efficiencies.
We also listened to the three party leaders. Premier Ford acknowledged that Cities and Towns are “closest to the people” and stated that the Government had no plans for Toronto-type election reform on other cities “in the near future.” The Premier ended his speech talking about his Government by stating: “A new day has dawned in Ontario.”
Obviously AMO also many includes educational sessions and panel discussions.
Because of Pelham Council’s ongoing work, I especially appreciated the panel about “campus-style” approaches for Long-Term Care and retirement homes. We can use some of these suggestions to further enhance Pelham’s plans for a new medical centre, new seniors affordable housing, new senior’s apartments, a retirement residence, and a long-term care facility in Fonthill. Scheduled to start over the next year, these new housing and service developments are planned around the new Community Centre, Wellspring Niagara’s new Regional Cancer Support Centre, and the new stores and restaurants.
I also attended an information session about “Cannabis and Communities” – where the Provincial representatives shared that one of the “first orders of business” for a Council will be to decide whether to “opt-out” of allowing recreational cannabis retail outlets in their City or Town.
Finally, I was pleased to attend a session by representatives of Petrolia, Sioux Lookout, and East Gwillimbury about ways in which they worked with neighbouring communities to combine services to residents and businesses or find efficiencies in those services. I am committed to helping these types of discussions among the cities and towns across the Niagara Peninsula.
Not only did the AMO Conference encourage your Pelham delegates to use “best practices” and reach higher goals, we also used it as a tremendous opportunity to advance your interests with Provincial Ministries and build relationships with other municipal leaders.
You may contact Mayor Dave at mayordave@pelham.ca and find documents and past columns at www.pelhammayordave.blogspot.ca.
Showing posts with label Niagara Region. Show all posts
Monday, August 27, 2018
Monday, April 16, 2018
Pelham’s 2018 Blended Residential Taxes Up 1.9% -- 12 Year Increase Less Than Inflation
If you pay your property taxes by installments, you will know that the second installment of your 2018 property tax bill comes due in two weeks (April 30). With this deadline approaching, I wanted to tell you about Pelham’s 2018 blended residential property tax increase – at 1.9% – and also to compare with other Cities and Towns.
You will recall that the amount of property tax you pay to the Town of Pelham, to the Niagara Region, and to the Province (for Education) is not solely based on the Market Value Assessment of your property by the Municipal Property Assessment Corporation (MPAC); one must multiply your assessment by each of these three tax rates and add them up for your total bill.
With both the Region and the Province making some policy changes and adjustments for rates and tax ratios, we now know that the combined property tax increase for an average residential property (which is valued at $328,138) in Pelham will be 1.9% for 2018. That means an average residential tax bill of approximately $4,187 or an increase of about $79 over last year. (Because of some rates changes, that’s actually a bit lower than the 2% to 2.3% range that I reported to you in February.)
You can consider this $79 or 1.9% a “pocket-book” increase – an increase in the amount it cost an average residential property owner because it’s adjusted for the average MPAC increase in Pelham.
Since Pelham’s portion of your property taxes represents roughly 39% of the total bill, the Town will make use of about $1,618 of the $4,187 for the average residential property.
Who gets the most? The Niagara Region will get about $2,012 or 48% of the total amount. Meanwhile, the Province will receive the remaining approximately $558 (or 13%) to help fund education.
How do we measure whether the increase is “affordable” or not?
One independent way to judge whether Pelham’s taxes are “affordable” is to compare with inflation. For example, the Bank of Canada calculated that, over the last 12 years (February to February), inflation increased the value of goods and services by 22.7%.
Over the same period, Pelham’s combined taxes for the average residential property increased by 22.0% – a bit lower than inflation. Essentially, that means that the average home is paying the same level of taxes in 2018 that they did in 2006!
And, this 22.0% over 12 years includes so many improvements in our community – from renewed Downtowns in Fonthill and Fenwick, to new Fire Halls in Fenwick and North Pelham, from nine renewed playgrounds, to a new skatepark and a new dog park, from a renewed Maple Acre Library to a renovated Old Pelham Town Hall, from 15 km of new sidewalks and 5 km of new trails to the new Meridian Community Centre. And, the list of other infrastructure and services goes on and on.
Another way to judge would be to compare with other Niagara Cities, Towns, and Townships.
Last Fall, the Region published a corrected table of non-blended property tax increases from 2010 to 2017 for local municipalities. If you start at zero in 2010 and add up the cumulative increases, Niagara Municipalities increased their property taxes an average of 35% over those eight years.
Pelham stands as the forth lowest because ours increased 30% – including an increase in funding for the Community Centre in 2016. That’s 14% below the average increase of other Cities and Towns for the same period. Three other growing Towns – Grimsby, Niagara-on-the-Lake, and West Lincoln were lower than Pelham since 2010.
Pelham Council and I continue to work together with staff to ensure that changes in property taxes only minimally impact you and your neighbour while improving the level and quality of services in the Town.
Please check out historic charts or read past columns at www.pelhammayordave.blogspot.ca. Please contact Mayor Dave at mayordave@pelham.ca.
Monday, December 4, 2017
Another Seat or Start Reform?
This Thursday, Regional Council will host a public meeting and consider a bylaw to add an additional member. This would bring Council to a total of 31 members, plus the Regional Chair. In addition to the 12 Mayors, our governing body currently includes 18 directly elected Regional Councillors – 6 from St. Catharines, 3 from Niagara Falls, 2 from Welland and one each from Grimsby, Lincoln, Niagara on the Lake, Thorold, Pelham, Port Colborne, and Fort Erie.
West Lincoln Township Council initiated the process to add another member a few months ago by asking the Region to petition the Minister of Municipal Affairs to allow the discussion. The Minister got back to the Region this Fall with his consent – and that debate will occur at the Region this week.
If approved Thursday, a majority of the 12 City, Town, and Township Councils representing a majority of Niagara’s population would need to approve it by the end of the year to allow the change for the 2018 election. (This Regional / Local / Population formula is known as a “Triple-Majority” requirement.)
West Lincoln argues that they need another Councillor because their population is growing and their only representative – the Mayor – finds it difficult to cover all the work and adequately represent the people in the Township.
According to the 2016 Canadian Census, the Township’s population grew 4.8% from 13,837 in 2011 to 14,500 in 2016. This is less than the 15,275 that Pelham had in 2001 when an additional seat was added for the 2003 election. (This was also before I began serving as Mayor in 2006.) The only other time since the start of the Region in 1970 that Council added a seat was in 1978 – one more for St. Catharines.
Interestingly, this change would mean that 39% of the Peninsula’s population (in community’s less than 45,000 people) would hold 55% of the seats on Regional Council. And, 61% of the population living in Welland (52293), Niagara Falls (88,071), and St. Catharines (133,113) would elect only 45% of Regional Council.
This suggestion for an additional seat offers an opportunity to consider and discuss the size, make-up, and overall election of Regional Council.
Some, like the Greater Niagara Chamber of Commerce, have pointed out for years that the Niagara Peninsula is the “the most over-governed large census division in Ontario” and suggests a “more thorough inquiry into means by which the Regional government can be made more efficient and representative.”
I think we owe to each resident and business across Niagara to think more broadly and act more boldly on this issue and many other issues.
For example, instead of thinking 25 years into the future and planning for rapid bus transit or LRTs, we just adopted a “Transportation Master Plan” that codifies thinking from seven years ago. Or the Region’s Water & Waste Water Master Plan doesn’t even call for stopping billions of liters of diluted sewage overflows into our lakes and rivers over the next quarter-century. And, despite the importance of rich agricultural land, Regional Council hopes to expand urban boundaries and create more sprawl. We even recently bumbled into our “first-time-ever” Councillor expense policy that sadly sanctions some of the most flagrant past-practices.
So, instead of unthinkingly stumbling into this change, let’s start the work now to look at potential solutions to reform Council.
To build a better Niagara and to improve our quality of life across the Peninsula, we need to reform our systems to balance representation, accountability, transparency and strategic policies and planning. And, we need to have started yesterday.
You may contact Mayor Dave at mayordave@pelham.ca or read past columns at www.pelhammayordave.blogspot.ca.
Monday, October 2, 2017
Comparing Pelham’s Household Income & Status
You may recall that I wrote here in June about Pelham’s population growth through the years. I based that analysis on previous Censuses.
A couple of weeks ago, Statistics Canada released another round of data from the 2016 Census of Population. These new data provided information on individual, family and household income for various levels of geography and demographic groups.
I find it not only interesting to examine the Pelham data, but to also compare Pelham with the Niagara Region (including Pelham) or with other Cities, Towns, or Townships in the Peninsula.
For example, in 2015, the median total income of households in Pelham was $95,052. This was the highest across all of Niagara! The next highest were Grimsby at $93,145, West Lincoln at $91,325, and Lincoln at $86,816. Across all of Niagara, the median total income of households stood at $65,086 in 2015 – nearly $30,000 less than Pelham.
But, that’s “median” income of all households in Pelham – the middle number across the distribution of all household incomes. What does that distribution look like and how does it compare with Niagara?
According to Statistics Canada, 46% of households in Niagara earned less than $60,000 in 2015; in Pelham, however, only 27% earned less than $60K. Those households in the next income range – from $60,000 to $124,999 – were 36% across all of Niagara and 39% in Pelham. However, there’s a huge difference in the next income bracket: 18% of households in Niagara earned $125,000 or more; compare that to Pelham where 34% of households earned more than $125,000 –nearly double the amount across Niagara.
Statistics Canada also tracked persons with low income. A single person was considered low-income if their after-tax income measure was below $22,460 in 2015. Stats Canada used a slightly higher number for larger households.
In 2015, 5.4% of Pelham’s population – or approximately 925 people – were considered low-income. We were the lowest percentage in the Region. Stats Canada shows Grimsby at 6%, West Lincoln at 7.1%, and Lincoln at 7.2%. But, the number is very high – 17.5% – for both Welland and St. Catharines. The Census reported 14.5% of people in Niagara Region were low income; this compared to Ontario, at 14.4%, and Canada, at 14.2%.
Finally, folks reporting being married or living common-law is also an interesting comparison. For example, Stats Can reported 67% of Pelham’s total population were either married (61%) or living with a common-law partner (6%). The remaining 33% were not married and not living with a common-law partner, including those who were single (never-married), separated, divorced or widowed. Across the Region, 57% of the total adult population were either married (48%) or living with a common-law partner (9%); and 43% were not married or living with a common-law partner.
Perhaps you suspected some of this information about our Town. Or, perhaps not. If you want to find out more, check out other info about Pelham at http://www12.statcan.gc.ca/census-recensement/2016/as-sa/fogs-spg/Index-eng.cfm
I intend to write more about housing, education, and employment in Pelham after Statistics Canada releases that data over the next two months.
You may contact Mayor Dave at mayordave@pelham.ca or read past columns at www.pelhammayordave.blogspot.ca.
Monday, July 24, 2017
Deficits and Levy vs. Development Charge Debt
Since that’s a lot of talk about debt lately, I thought I’d write about it here.
While the Provincial and Federal governments and businesses can run deficits, Towns and Cities cannot.
Deficits occur when a Federal or Provincial government spends more on their services and projects during their fiscal year than their revenue for that year. Adding up this overspending is called an accumulated deficit which becomes Federal / Provincial debt. And, that Federal and Provincial debt includes both operating costs (program spending) and capital expenditures.
Sometimes businesses can do the same. A small business could continue to operate for a while, accumulating their weekly loses into a relatively large deficit. This type of spending can last as long as their directors or creditors allow.
On the other hand, Towns and Cities must run balanced books each year. We cannot budget for a deficit nor a surplus, nor can we accumulate deficits.
So, how do we mitigate unexpected expenses or pay for large capital projects? With reserves and municipal debt (called debentures).
Sometimes we accumulate specific funds over a few years in a reserve to help pay for something in a future year. For example, we might set $100,000 aside for a few years so that we can buy a $400,000 fire truck in year four. Or, we established a snow clearing reserve to cover excess operating costs for winter control methods (if required).
For multi-million-dollar community assets, however, it might not make sense to save up for decades in advance.
For example, does it make sense to pre-charge residents for a number of years to save up for a multi-million-dollar water project when the asset will be used over 70 years? Why should people who move or pass away prior to a project’s construction pre-pay for an entire project? Wouldn’t it be better to allow folks benefitting from the project pay as they use it?
One could make the same case for a 50-year asset like a community centre or a 25-year asset like a downtown redevelopment. It’s often in these types of cases that “smart debt” – a debenture period of less than the life of the asset – makes sense. And, since municipal debentures lock in the interest and principal payments for the entire life of the loan, they provide certainty on pay back amounts. Once approved, interest rate hikes or changes do not impact these locked-in debenture payments.
And, many find this approach beneficial during periods of low interest rates and infrastructure grants from other Governments. For example, a portion of Pelham's debt includes our share of Downtown Fonthill’s revitalization and Fire Station #2 construction after taking advantage of more than $4.1 million of Federal and Provincial stimulus funding. If we didn't use this type of smart debt to pay for those projects, we would have left that $4.1 million (representing 66% of the project costs!) on the table for another community to use. We used the same approach for Haist Street reconstruction and for our nine new, fully accessible playgrounds.
Finally, much of the Town's long term debt is to help support new development and is, therefore, not funded by existing residents and businesses.
You may know that Development Charges are applied on new developments – from new homes to new commercial buildings – to help pay for the facilities and capital projects that are required to support that new development. For example, if a road needs to be widened, a new water line installed (like on Rice Road), a Fire Hall expanded, or a new trail system built, that new development needs to pay for those new items. Development Charges allows “growth to pay for growth.” And, that’s good news for current residents and businesses.
But, sometimes those facilities or improvements need to be built or installed ahead of the growth – like that new water or sewer line or new Fire Station – to help serve and stimulate the growth. In fact, this approach was encouraged by the Niagara Homebuilder's Association and others at the Region this month as Regional Council considered a new Development Charge bylaw. In these cases, the Town might build the project but add the debt to the Development Charges account; in this case, those Development Charges pay for both debt interest and principal and the new development projects get build ahead of time.
Since we have been preparing for growth for a while, more than 55% of Pelham’s long-term debt is for these Development-Charge-funded projects. (And, these are some of these type of DC-funded debt projects in the Region's new Development Charges bylaw too.) To be clear: more than one-half of our long-term debt will not be paid back by existing residents and tax-payers, but, rather, by new development.
Pelham Council and I continue to ensure that we only minimally impact you and other property tax-payers while we continue to improve our infrastructure and increase the quality of life in our Town.
You may contact Mayor Dave at mayordave@pelham.ca or read past columns at www.pelhammayordave.blogspot.ca.
Monday, June 26, 2017
Comparing Pelham’s Residential Taxes
If you pay your property taxes by installments, you will know that your third installment of your 2017 property tax bill comes due on Friday. With this deadline, why not “take stock” of Pelham’s property taxes and compare with other Cities and Towns?
You will recall that the amount of property tax you pay to the Town of Pelham, to the Region, and to the Province (for Education) is not solely based on the Market Value Assessment of your property by the Municipal Property Assessment Corporation (MPAC); one must multiply your assessment by each of these three tax rates and add them up for your total bill.
With the Region and the Province making some last policy changes and adjustments for rates and tax ratios, we now know that the combined property tax increase for an average residential property (which is valued at $316,400) in Pelham is 2.0%. Because of those changes, that’s actually a 0.3% decrease from what I reported to you in April.
You can consider this 2.0% a “pocket-book” increase – an increase in the amount it cost an average residential property owner by adjusting for the average MPAC increase.
How do we measure whether that amount is “affordable” or not?
One independent way to judge whether Pelham’s taxes are “affordable” is to compare with inflation. For example, the Bank of Canada calculated that, over the last 11 years (January to January), inflation increased the value of goods and services by 19.7%. Over the same period, Pelham’s combined taxes for the average residential property in Pelham increased by 19.7% – the same level as inflation. Notionally, that means that the average home is paying the same level of taxes in 2017 that they did in 2006.
And, this 19.7% includes the equivalent of approximately 1.1% (in 2016) to fund the Pelham Community Centre. And, it also includes our annual increases for improved infrastructure – approximately 1.7% over the last three years, for example – supporting new roads, pipes, and other capital improvements.
What about a more concrete way to judge? How about if we compare Pelham with other Niagara Cities, Towns, and Townships?
Last November, the Region published a table of non-blended property tax increases from 2010 to 2016 for local municipalities. If you start at zero and add up the cumulative increases from 2010, Niagara Municipalities increased their property taxes an average of 35% over the last seven years.
Pelham stands-out as the second lowest by increasing at 25% – including funding for the Community Centre in 2016. That’s 27% below the average increase. Only Grimsby was lower than Pelham (at 23%). Even the Region was higher than the Town, at 29% (if you don’t include the benefit of Provincial uploading).
Pelham Council and I continue to ensure that we only minimally impact you and other property tax-payers while we work to increase the level and quality of services in the Town.
Check out historic charts or read past columns at www.pelhammayordave.blogspot.ca. Please contact Mayor Dave at mayordave@pelham.ca.
Monday, May 15, 2017
Pelham Changing Through the Years
Since Statistics Canada recently released additional information from the 2016 Census, I thought I would write here about the demographics of Pelham. And, since they also provide information for communities from the 2011, 2006, 2001 and 1996 Census, one can compare the make-up and changes of our population over a twenty-year period.
As you may know, Pelham is among the fastest growing communities in the Niagara Peninsula. Since our formation in 1970, we have grown from 9,855 to 17,110 in 2016. That’s a 74% increase!
Other large population increases include Grimsby at 80%, West Lincoln at 76%, and Lincoln also at 74%; compare this with the entire Region’s population which grew by only 33% during that period.
During the last 20 years, Pelham’s population grew from 14,345 in 1996, to 15,275 in 2001, to 16,155 in 2006, to 16,598 in 2011, to 17,110 in 2016. That’s more than 19% population growth over 20 years.
But, the story becomes more interesting when one looks at age groups.
For example, our Town’s population of children and youth (aged 24 and younger) declined slightly (6%) in raw numbers over the last couple of decades. This cohort numbered 4,820 in 1996 and 4,515 in 2016. The number of children and youth represented more than 26% of our population last year and essentially matched the proportion across the Niagara Peninsula (which stood at 27% of Niagara’s total population in 2016).
What about our seniors – those aged 65 and older? In 1996 there were 1,925 seniors in Pelham; in 2016 Statistics Canada counted 4,175. That’s a 117% increase! Seniors now make up 24% of our population. That’s up from 13% in 1996. Across the Region, the proportion of seniors was 21% in 2016.
Statistics Canada provides some very broad categories for comparison over the last 20 years. For example, Pelham’s population aged 25 to 54 (the “working-age” population) declined just over 8% from 6,095 people in 1996 to 5,595 in 2016. This working age group counted for 33% of Pelham’s population in the last census.
So, broadly speaking, where was the majority of our growth concentrated through the last 20 years? Those 55-and-older grew a phenomenal 104% from 3,400 in 1996 to 7,010 in 2016!
(It is important to note that these demographic changes result from both new residents moving here, others moving away, and from the aging of current residents.)
While one must be cautious about broad comparisons from relatively small sub-sets of our population, these numbers obviously show trends. Please rest assured that Council and I continue to consider these demographic realities as we provide public services and develop community economic development initiatives.
Labels:
Census,
Niagara Region,
Pelham,
Population,
Statistics Canada,
Town of Pelham
Sunday, January 22, 2017
"Dual Duty": A Less Democratic, Out-of-Date Approach
Do you think we should elect more full-time politicians in Niagara?
Should it be harder for people to represent the views of their neighbours? Or, should anyone be able to serve part-time on local Council and offer their experiences from a job or other activities?
People are asking these thoughtful questions about the "dual duty, ward Councillor" proposal for the City of St. Catharines and Niagara Regional Councils.
Currently, St. Catharines elects 12 part-time (PT) City Councillors (two in each of six wards), and six part-time Regional Councillors ("at-large" across the City). City residents also elect a full-time (FT) Mayor who serves on both Councils. That’s 19 people (12 PT + 6 PT +1 FT = 18 PT & 1 FT) representing citizens on the two Councils.
The change would see St. Catharines represented by 13 people: the Mayor and six full-time politicians would serve on both City and Regional Councils; the other six part-time Councillors would serve only on City Council (6 FT + 6 PT + 1 FT = 6 PT & 7 FT).
Proponents suggest that by reducing the number of local representatives "communication, cooperation, and accountability" would increase between the City and Region.
Opponents suggest that the change will create six more full-time politicians (who would want "full-time wages"), attract partisans, and make local government less accountable and more out-of-touch from average citizens. Others believe it would give more control to fewer people (like at the NPCA where 11 of the 12 Niagara reps were appointed by the same Regional Council on which they serve).
Interestingly, the majority from across Niagara – more than 58% according to a survey last Fall – do not want the change.
And while proponents say that the dual duty "modernizes" communication and coordination of local government, we know that other Regions made similar changes more than 25 years ago. That was before AOL email (21 years old), Google (18 years), and web browsers like Netscape (21 years). That was also before the widespread use of cell/smartphones and cheap long-distance calling. At that time, everything was paper-based and getting a fax felt like a novelty.
Now, we live stream and archive Committee and Council meetings, pre-publish complete electronic agenda packages, and use smartphones, cellular iPads, texts, social media, pictures, videos, and emails to communicate instantly with colleagues, staff, and citizens.
Further changes over the last decade include routine meetings between Regional and City / Town chief administrative officers, planners, economic development officers, treasurers, engineers, transit managers, clerks, and Mayors. In some Towns – like Pelham and Fort Erie – the Regional Councillor presents written updates to local Council and answers questions every three weeks.
Because we solved these communication and coordination issues long ago, and because it will concentrate power into the hands of fewer people and increase the number of full-time politicians, I voted against the dual duty proposal last Thursday at Regional Council.
Since it was approved by a 17 to 11 vote, each local Council will also consider the proposal; please let your City, Town or Township Councillor know your thoughts.
![]() |
| Current: 18 part-time Councillors, 1 full-time Mayor |
People are asking these thoughtful questions about the "dual duty, ward Councillor" proposal for the City of St. Catharines and Niagara Regional Councils.
Currently, St. Catharines elects 12 part-time (PT) City Councillors (two in each of six wards), and six part-time Regional Councillors ("at-large" across the City). City residents also elect a full-time (FT) Mayor who serves on both Councils. That’s 19 people (12 PT + 6 PT +1 FT = 18 PT & 1 FT) representing citizens on the two Councils.
The change would see St. Catharines represented by 13 people: the Mayor and six full-time politicians would serve on both City and Regional Councils; the other six part-time Councillors would serve only on City Council (6 FT + 6 PT + 1 FT = 6 PT & 7 FT).
Proponents suggest that by reducing the number of local representatives "communication, cooperation, and accountability" would increase between the City and Region.
Opponents suggest that the change will create six more full-time politicians (who would want "full-time wages"), attract partisans, and make local government less accountable and more out-of-touch from average citizens. Others believe it would give more control to fewer people (like at the NPCA where 11 of the 12 Niagara reps were appointed by the same Regional Council on which they serve).
![]() |
| Proposed: 6 full-time dual duty Councillors, 6 part-time Councillors, 1 full-time Mayor |
And while proponents say that the dual duty "modernizes" communication and coordination of local government, we know that other Regions made similar changes more than 25 years ago. That was before AOL email (21 years old), Google (18 years), and web browsers like Netscape (21 years). That was also before the widespread use of cell/smartphones and cheap long-distance calling. At that time, everything was paper-based and getting a fax felt like a novelty.
Now, we live stream and archive Committee and Council meetings, pre-publish complete electronic agenda packages, and use smartphones, cellular iPads, texts, social media, pictures, videos, and emails to communicate instantly with colleagues, staff, and citizens.
Further changes over the last decade include routine meetings between Regional and City / Town chief administrative officers, planners, economic development officers, treasurers, engineers, transit managers, clerks, and Mayors. In some Towns – like Pelham and Fort Erie – the Regional Councillor presents written updates to local Council and answers questions every three weeks.
Because we solved these communication and coordination issues long ago, and because it will concentrate power into the hands of fewer people and increase the number of full-time politicians, I voted against the dual duty proposal last Thursday at Regional Council.
Since it was approved by a 17 to 11 vote, each local Council will also consider the proposal; please let your City, Town or Township Councillor know your thoughts.
Labels:
Democracy,
Dual Duty,
Fort Erie,
Mayor Dave,
Mayor Dave Augustyn,
Niagara Region,
Pelham
Monday, November 21, 2016
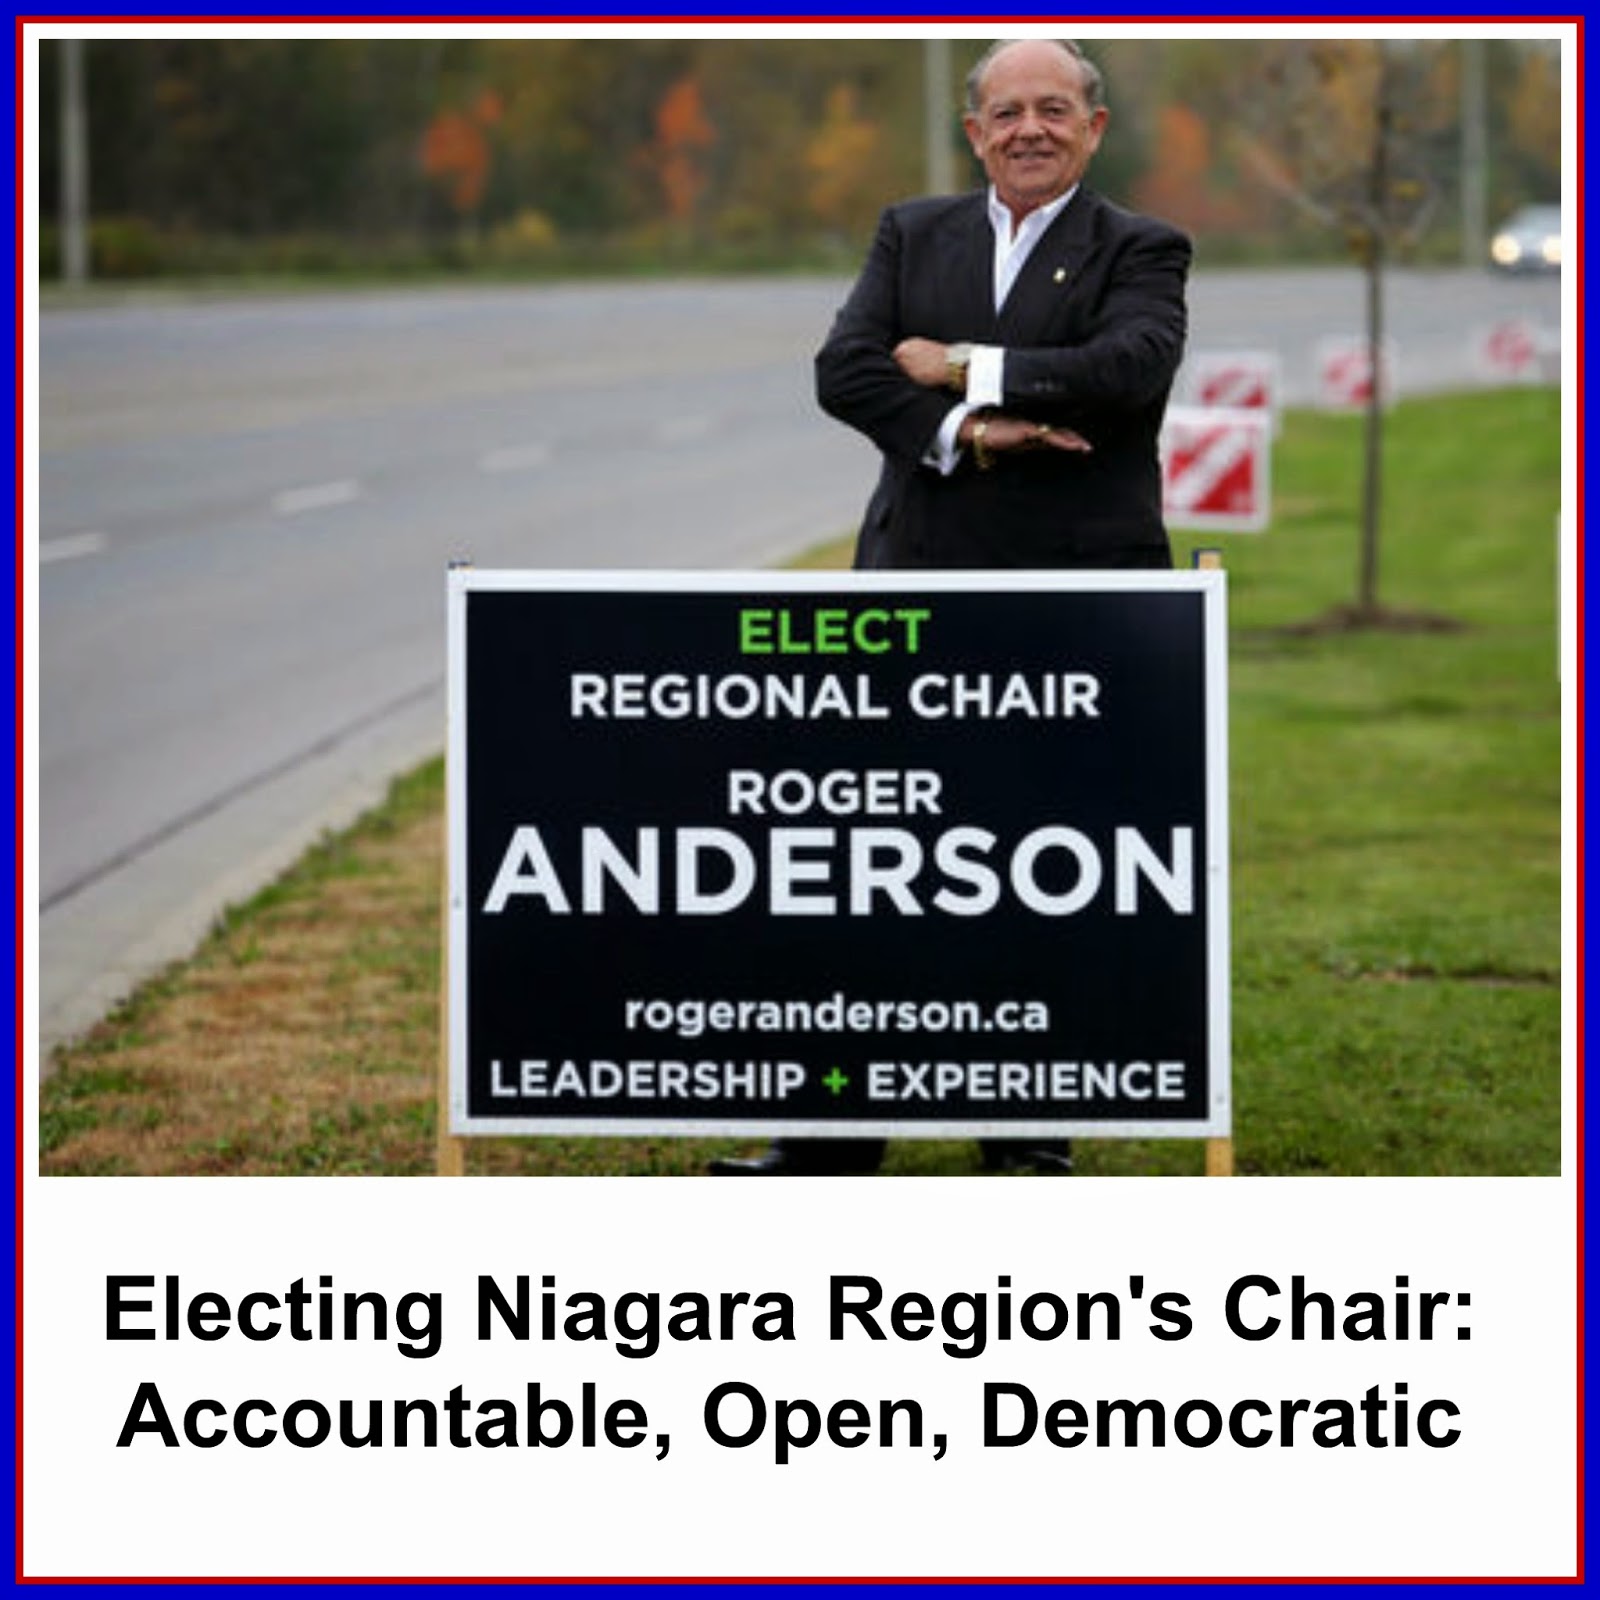
Let’s Embrace Publicly Electing the Regional Chair
![]() |
| Hon. Bill Mauro, speaking at AMO, August 2016 |
First, during the Association of Municipalities of Ontario (AMO) conference in August, the Hon. Bill Mauro, Minister of Municipal Affairs, called for changes to increase the “accountability and transparency” of Regional Councils.
Second, Niagara stood as the only hold-out Region that still wanted to appoint the Chair from among members of Council. All other areas either already elect their Chair of Regional Council at large, or were working toward doing so.
Waterloo Region began electing their Chair 19 years ago. Halton Region has elected a Regional Chair since 2000. Durham Region first elected their Regional Chair in 2014.
A bill to elect the York Regional Chair at large was recently before the Ontario Legislature. And, in 2013, Peel Regional Council directed staff to report after the 2014 election on options to directly elect their Chair for the 2018 municipal election.
Finally, with the next municipal election two years away, the Province needed to announce changes now to give various municipalities time to appropriately adapt.
Surprisingly, some suggested that it would be too difficult for Regional Chair candidates to campaign across the equivalent of four Federal ridings that cover our peninsula. Interestingly, Niagara would actually be the smallest area: 4 ½ ridings cover Halton Region; 5 ridings cover Waterloo; and 5 ½ ridings cover Durham.
Similarly, some suggest that the cost to mount a campaign would keep good candidates out of the race. While the spending limits in Halton, Waterloo and Durham are higher than it will be for Niagara (estimated to be $306,000), the most any candidate spent in those campaigns were nowhere near the limits. Winning candidates spent $16K in Halton; $56K in Waterloo; and $74K in Durham.
With this latest improvement, candidates for the Chair’s position will have to put together a vision that would appeal to all of Niagara. This would be similar to the visions that Mayoral candidates present to the public – but it would be for all in the peninsula.
I believe that this change would will help us to work together to become more open, transparent, accountable, and democratic in Niagara.
Let's embrace this improvement because publicly electing the Regional Chair will help pull the views and hopes of our Region’s citizen’s together and can become an important and unifying force for moving Niagara forward.
Sunday, September 18, 2016
Assessment Only Half the Picture
Have you received your new residential property assessment notice from MPAC – the Ontario Municipal Property Assessment Corporation? (If you own a farm, business, or multi-residential property, you should receive your assessment mid-October.)
Updated for the first time since 2012, your notice will outline MPAC’s determination of the market value of your property as of January 1, 2016.
MPAC considers many factors when assessing property values, such as the sale prices of comparable properties in your neighbourhood, and the age, location, characteristics, and size of your property and home. In essence, MPAC strives to base their value on the amount your property could have sold for on the open market.
Just like in 2012, property assessments will remain the same for the next four years – from 2017 to 2020. However, if the value of your property increases, that increase will be phased in over the four years; if the value goes down, you will immediately see a reduction.
For example, if the value of your home increased by $20,000 over its current assessment, the value for determining your property tax will increase by $5,000 per year over the next four years.
If the value of your home goes up, does that mean that your property taxes will also go up?
No, not necessarily. Market Value Assessment is only one half of the property tax equation. The amount you pay to the Town of Pelham, to the Region, and for Education is based on the Market Value Assessment of your home multiplied by the three tax rates and added together.
Say the Town budgeted for revenues of $10 million from property taxes in 2017. If all assessments double, the Town would cut the tax rate in half to collect that $10 million. If everyone’s assessments went down, we would increase the rate to collect the same $10 million.
But, what if your assessed value increases more than the average?
The property tax system is a bit of a blunt instrument. Municipalities set the tax rate based on the average assessment for each of the tax classes – residential, multi-residential, commercial, industrial, farm/managed forest, pipelines.
If your property’s assessed value increases more than the average, you will likely pay more than the average tax. By the same token, if your assessed value increases less than the average, you will likely pay less tax.
What if you don’t think the MPAC assessment on your property is correct? You can issue a “request for reconsideration” before November 30, 2016 for residential properties so that MPAC will review your assessment. (Owners of farm, business, and multi-residential properties must file reassessment requests 120 days from the assessment issue date.)
Please check out MPAC’s website (www.mpac.on.ca) and your notice for more information.
Sunday, April 17, 2016
Pelham’s 2016 Residential Taxes Increases by 2.4%
Two months ago I wrote about how Council approved our 2016 Operating Budget. Since the Province issued the property tax rate for Educational purposes last week, I can now provide you with an update on the total 2016 residential property tax bill.
You will recall that the amount of property tax you pay to the Town of Pelham, to the Region, and to the Province (for Education) is not solely based on the Market Value Assessment of your property; we multiply your assessment by each of these three tax rates and add them up for your total bill.
The Municipal Property Assessment Corporation (MPAC) – the Provincial body that sets a value your home and property – re-evaluated and assessed all properties in the Province as of January 1, 2012. While this amount will be used as the value of your home in 2016, MPAC phases in any assessment increases evenly over a four-year period. The Town uses that changing assessment value when we calculate your property taxes each year.
When Town Council approved our 2016 Operating Budget in February, we didn’t know neither the Regional nor the Provincial rates.
Now that the Region approved the property tax rates and ratios last month and that the Province set their rate last week, we know that the combined property tax increase for an average residential property (valued at $309,200) in Pelham will be 2.4%.
Please note that this 2.4% is the “pocket-book” increase – the amount it cost an average residential property owner by adjusting for the average MPAC increase.
(I am sure that you would be interested to know that approximately 1.1% of this 2.4% is attributable to the one-time increase for the Pelham Community Centre.)
How do we measure whether that amount is “affordable” or not?
One independent way to judge whether Pelham’s taxes are “affordable” or not, is to compare them with inflation. For example, the Bank of Canada calculates that, over the last 10 years, inflation increased the value of goods and services by 17.7%. Over the same period, Pelham’s combined taxes for the average residential property in Pelham increased by 17.4% -- slightly less than inflation. And, this includes the amount already included in the Town’s 2016 budget to help fund the Pelham Community Centre.
Pelham Council and I continue to direct staff to ensure that we only minimally impact you and other property tax-payers while we increase the level and quality of services to the Town.
Sunday, March 6, 2016
“Three-Peat” Freeze & Best in Niagara
How are we able to freeze rates for 2016 and how do we compare to others in Niagara?
RF Meters Paying Dividends:
Prior to 2010 the Town measured water usage and calculated waste water charges with old gallon and cubic meter odometer-type wheel meters – many from the 1960s and 1970s. Many of the aged-meters counted slowly or were failing/broken. It took two weeks to collect readings. If a system leaked, it could take months to detect.
In 2010, the Town worked with Neptune Technology to replace and upgrade all 4,200 our meters to electronic, RF (Radio Frequency) meters. In addition to leak, backflow, and tamper detection, it only takes 3-4 hours for staff to collect usage data every two months.
Not only does this cost less and give much more accurate billing, but we also automatically notify residents / businesses by phone if there is a leak or other issue with their water service. And, after replacing all the meters, we reduced our water loss from +20% to less than 10%.
Infrastructure Upgrades:
As you know, we have also upgraded significant Town infrastructure over the last number of years. As we reconstructed or improved roads like Haist Street, Pelham Street, and Canboro Road we also replaced old water and sewer pipes. Over the last nine years, we replaced more than 13 kilometers of cast iron water mains, which helped stop costly leaks and reduces the number of breaks and repairs.
Best in Niagara:
I reviewed the most up-to-date rates and calculated the fixed charges and the rates for both water and waste water for Pelham and for the other local municipalities. At $161 for two months (for the average residential use of 50 cubic metres) Pelham leads the pack with the lowest combined water and waste water charges!
Half of our neighbours – Niagara-on-the-Lake, Niagara Falls, St. Catharines, Thorold, and West Lincoln – are between 19% and 29% more expensive. The others – Fort Erie, Lincoln, Port Colborne, and Welland – are more than 49% more expensive! (Please see the comparative chart at by clicking here for all the details.)
Council and I are pleased that our investments in innovation and infrastructure continue to pay dividends and allow us to “three-peat” the water and sewer rate freeze.
Sunday, February 21, 2016
Pelham's 2016 Operating Budget Approved
Council recently approved the Town’s 2016 Operating Budget. The new budget translates into an increase of approximately 7.86% (or $107.44) on the Pelham portion of your property tax bill for the average residential property (assessed at $309,200).
Since Pelham’s portion of your property taxes represents roughly 37% of your overall residential tax, we anticipate the average “blended” increase – including the Regional and Provincial portions – to be around 2.9%.
In preparing for the operating budget, Council directed Staff to review all expenditures against customer service needs and the Town’s strategic plan.
The overall budget increased by $792,873 (net). The major increases over 2015 include:
• A $269,830 transfer to the capital reserves to help enhance and maintain our excellent infrastructure and build on the $175,979 that we added to capital reserves last year;
• $79,629 for increased maintenance and $49,731 for increased utility costs for Town facilities;
• $11,007 to increase the Pelham Public Library grant to fund the Library’s cost-of-living-adjustments (COLA) and to double the hours of the renewed Maple Acre Library branch – from 14 to 28 hours per week – starting in November.
• $250,786 for Staff wage and benefit increases. This includes a 1.3% COLA increase, performance management compensation, and required benefits increases (of approximately 10%).
• And $416,984 for additional principal and interest payments. (See below for more details.)
These net to an increase of $792,873 because of the benefits of new assessment growth ($184,469) and of other expected revenue increases ($100,625).
As I wrote about a few weeks ago, Council earmarked $37 million in the Town’s 2016 Capital Budget toward constructing a potential Community Centre. We did this because we are getting close to a final draft design and so that we might be “shovel ready” for potential investments from upper-levels of government.
So that we might be further ready, Council now earmarked operating funds for principal and interest payments that would allow the Town to purchase at least a $5 million, “re-payable,” 30-year debenture from Infrastructure Ontario (at an estimated rate of 3.48%). Council would only approve this debt if we proceed with a proposed Community Centre; if we do not proceed in 2016, the funds will accumulate in a special reserve.
Draft Designs Soon: On a final note, the Architect and Construction Manager anticipate that they can present draft designs, including elevations and more accurate construction cost estimates, by March 21. Council wants to understand your thoughts and feelings on the proposed design and financing of a potential Community Centre in late-March and early-April before we make further determinations. We look forward to that informed discussion!
For more information about Pelham’s Operating Budget, please click here.
Sunday, July 19, 2015
Dual-Duty Councillors Across Niagara?
![]() |
| Photo Credit: St. Catharines Standard. |
Currently, St. Catharines elects 12 City Councillors (two in each of six wards), and six Regional Councillors (“at-large” across the City). City residents also elect a Mayor who serves on both Councils. That’s 19 people (12+6+1) representing the City on the two Councils.
The request would see St. Catharines represented by 13 people: the Mayor and six Councillors would serve on both City and Regional Councils, while the other six would serve only on City Council (6+6+1).
Proponents suggest that the change will reduce the number of local representatives and increase the “communication, cooperation, and accountability” between the City and Region.
Opponents suggest that the change will turn six into full-time Councillors, make local government less accountable, give “more control to developers” and political parties, and allow fewer people to make decisions.
While this double role model might work well for St. Catharines, it doesn’t work as neatly across all Niagara’s Cities and Towns.
It could work in Niagara Falls, Niagara-on-the-Lake, and Thorold because their local Councillors are elected at-large. Niagara on the Lake’s and Thorold’s at-large elections could elect one person to both the local and Regional Councils and seven to local Councils; the Niagara Falls election could elect three to the City and Regional Councils and five others to City Council only.
But, this dual role model doesn’t work for in other Cities / Towns with ward systems because the number of local ward seats do not neatly match the Regional seats: Fort Erie (6 wards / 6 local councillors / 1 regional councillor), Grimsby (4w / 8lc / 1rc), Lincoln (4w / 8lc / 1rc), Pelham (3w / 6lc / 1rc), Port Colborne (4w / 8lc / 1rc), Welland (6w / 12lc / 2rc). (Only the Mayors of Wainfleet and West Lincoln serve on Regional Council.)
If the Region agrees to the proposal, the Province will ask for at least one public meeting and require approval by the Region, and by a majority of the Cities, Towns, and Township Councils representing a majority of Niagara’s population.
While I am might support this change for St. Catharines, this dual-role plan will not work across Niagara. Nor is it needed in Pelham because we receive a written and verbal report by Regional Councillor Baty at every Town Council meeting.
Finally, while we discuss improving governance, I will continue to advocate for directly electing the Chair of Regional Council “at large” across all of Niagara.
Saturday, April 25, 2015
Please Help Protect the Fonthill Kame, Again!
The Ontario Government is currently seeking feedback as they review four land-use plans: Greenbelt Plan, Growth Plan for the Greater Golden Horseshoe, Oak Ridges Moraine Conservation Plan, and Niagara Escarpment Plan.
On behalf of Pelham Town Council, I recently wrote to the Expert Advisory Panel of this Land-Use Planning Review and implored them to increase the protection of the Fonthill Kame. I am hoping that you too will write to the Panel to indicate your support.
The “Fonthill Kame-Delta” is Niagara’s rare, 75-metre-tall landmark that was formed by retreating glaciers 13,000 years ago. At 6 km long, 3 km wide, and nearly 1,000 hectares, the Fonthill Kame boasts the highest point in the Niagara Region. As the “hill” in Fonthill and Shorthills and the “ridge” in Ridgeville, the feature also serves as a significant water recharge area and forms the headwaters of the Twelve Mile Creek. Further, the Kame’s microclimatic and soil conditions create an ideal environment for tender fruit production including peaches, sweet and sour cherries, plums and pears.
The Ministry of Natural Resources (MNR) identified the Fonthill Kame as provincially significant in 1976 and as a Provincial “Area of Natural and Scientific Interest” (ANSI) in 1988 as a way to help restrict development.
The Province also protected parts of the Kame with general provisions in either the Niagara Escarpment Plan or specific provisions in the 2005 Greenbelt Plan.
And, you will recall that after considerable public feedback, research and scientific evaluation, MNR confirmed a new ANSI boundary for the Kame in October 2013.
Sadly however, despite these efforts to protect it, residential development and aggregate extraction pressures seriously threaten the Kame.
As the Province reviews the Greenbelt Plan and the Niagara Escarpment Plan, they could inadvertently (or purposefully!) lessen these protections of the Fonthill Kame.
That’s why I wrote the Expert Panel and urged them to reinforce the recent ANSI re-designation by increasing the protection of the Fonthill Kame in their land use Plans. (Please click here to review a copy of my letter.)
Now, I am asking you to provide similar feedback to the Panel before May 28; please let them know that you are interested in protecting the Kame and curtailing further aggregate extraction or development.
Please email your comments to landuseplanningreview@ontario.ca or send mail to:
Land Use Planning Review
Ministry of Municipal Affairs and Housing
Ontario Growth Secretariat
777 Bay Street
Suite 425 (4th floor)
Toronto, ON M5G 2E5.
Thank you for helping to further protect the Fonthill-Kame so that its distinctive features, microclimatic and water recharge functions might be better safeguarded for future generations!
Monday, January 12, 2015
Electing Niagara Regional Chair to Become More Accountable, Open & Democratic
![]() |
| Roger Anderson was victorious as the first elected chair of Durham Region, 2014. |
Role of the Chair:
The full-time Regional Chair sets the legislative and economic agendas for the Region, presides over Council meetings, votes on every committee, and is the “face” of Niagara with Provincial, National, and other governments.
So, while serving as the face of the entire Niagara Region, ironically, the Regional Chair is only accountable to the majority of Regional Councillors.
Baldwin Act & County Councils:
Our current process of appointing a sitting member of Council as chair comes from the Baldwin Act of 1849, which established local County Councils. The names of the annually appointed, former Wardens of Welland County and Lincoln County are etched on two plaques at the Regional HQ (across from Brock University).
When they first created Regional Governments in the 1970s, the Province also appointed the first Regional Chairs. After our first Chair (John Campbell) retired in 1985, Council appointed one of its own as Chair (Wilber Dick).
But, this appointment differs significantly from County Councils days – the new Chair give up his or her seat and is appointed for the entire four-year term of Council.
Lagging Behind Other Regions:
All other Ontario Regional governments have already either adopted a more accountable and democratic process to directly elect their Regional Chair at large or are in the process of doing so.
Waterloo Region (Kitchener, Waterloo, Cambridge, Wilmot, Wellesley, Woolwich, and North Dumfries) began electing their Chair 17 years ago. Halton Region (Burlington, Oakville, Milton, and Halton Hills) has elected a Regional Chair since 2000. Durham Region (Pickering, Ajax, Uxbridge, Oshawa, Whitby, and Clarington) first elected their Regional Chair last Fall.
A bill to elect the York Region (Aurora, East Gwillimbury, Georgina, King, Markham, Newmarket, Richmond Hill, Vaughan, Whitchurch–Stouffville) Chair “at large” is currently before the Ontario Legislature. Finally, in 2013, Peel Regional Council (Brampton, Mississauga, and Caledon) directed staff to report in 2015 on options to directly elect their Chair for 2018.
It’s Time for Niagara:
It’s clear that the way in which Niagara Region currently appoints our Regional Chair is antiquated, undemocratic, and out-of-synch with all other Regions in Ontario.
That’s why I am making a motion at Regional Council on Thursday to begin the process to change toward a directly elected Chair. If you agree, please contact your Regional Councillor.
Let's work together now to become more open, transparent, accountable, and democratic in Niagara!
Monday, August 25, 2014
Promoting Pelham’s Interests at AMO Conference
Last week, Councillors King and Papp, Town CAO Darren Ottaway, and I attended the 115th Annual Association of Municipalities of Ontario Conference (AMO). The Annual Conference offers a range of learning sessions and networking opportunities for municipal leaders. More than 1,200 delegates attended the three-day event in London themed “At the 4front.”
While at AMO, your Pelham reps also directly advanced your interests with the Provincial Government through meetings with various Ministries.
First, we met with the Lou Rinaldi, MPP & Parliamentary Assistant to the Minister of Municipal Affairs & Housing, to propose changes to the Greenbelt Plan and to the Ontario Municipal Board (OMB). We asked that the commercial district of Ridgeville be included as a “hamlet” during the 2015 review of the Greenbelt; we also suggested that the Government relax the rules to make it easier for Towns to build Fire Stations in the Greenbelt and that they consider more flexibility for farm operations. Then we suggested improvements to the OMB appeal process based on the months and months of delays we faced before the ultimate approval of the Town’s Official Plan and East Fonthill Secondary Plan.
Next, we met with Arthur Potts, MPP & Parliamentary Assistant to the Minister of Agriculture & Rural Affairs regarding a potential multi-faceted community centre. We outlined the extensive process we have used to determine the need for and feasibility of a centre; we also explained our need for Provincial funding to help make the construction more affordable. Finally, we outlined the other important developments in the East Fonthill area – the medical centre, the retirement home, the home for Wellspring Niagara, and the additional retail businesses.
Then, we met with Kathryn McGarry, MPP & Parliamentary Assistant to Minister of Transportation, regarding the proposed streetscape cross-sections – including separate bike and walking paths – and the construction of a public square in the East Fonthill development. We also asked to work together with MTO to increase the “way-finding” signage to Pelham.
We met also with Eleanor McMahon, MPP & Parliamentary Assistant to Minister of Natural Resources and expressed our deep appreciation for the recent protection of the Fonthill Kame as an Area of Natural & Scientific Interest (ANSI). The Ministry protected the Kame after our five years urging and we requested that protections remain untouched for many decades.
Finally, I also joined other Niagara Mayors and the Regional Chair to meet with the Honourable Steven Del Duca, Minister of Transportation, to express the rational for an extension of GO transit commuter rail service to Niagara Region.
Please be assured that Council and I will continue to take all opportunities to promote Pelham’s interests to the Provincial Government.
Monday, December 9, 2013
Budgets Mean More Improvements in 2014
Since Town Council approved our 2014 Capital Budget last week and Regional Council is set to approve our 2014 Operating, Capital, and Rate budgets this week, I wanted to inform you about some major improvements planned for Pelham next year.
“Uptown Fonthill” Reconstruction:
Regional Council’s 2014 Capital Budget includes $4.0 million (including nearly $1 million from the Town) to reconstruct Regional Road 20 from Peachtree Park to Lookout Street, and to reconstruct Haist Street from Canboro Road to RR20. The works will include adding bikelanes, adding new sidewalks, upgrading the watermain, road reconstruction (including a turning lane to Haist Street North), and a new traffic signal. Regional staff hopes to begin work in early-spring and be done in early-September. Because of significant developments between Haist and Lookout on Hwy 20, I refer to this area as “Uptown Fonthill.”
Downtown Fenwick Revitalization:
While Council budgeted funds to revitalize Downtown Fenwick in 2013, staff ran into delays with design, with added work (storm sewer to Church Street) and with utilities. In 2014 we budgeted $4.0 million to reconstruct the roads, bury the hydro lines, and make the Downtown more pedestrian friendly. The consulting engineers will meet with the public on December 19 to review the final design with the hope that work can begin in early-spring. Council directed staff to ensure as little negative impact on Downtown businesses as possible.
Peace Park:
Council earmarked funds to landscape and improve Peace Park so that the overwhelming success of the Fonthill Bandshell, the Farmer's Market, and Summerfest can grow. The plan includes tiered seating (for lawn chairs) around the Bandshell, fully-accessible internal pathways, enhancing the cenotaph, and opening-up the park for more multi-use activities. Council directed staff to ensure these improvements do not interfere with the June start of the Bandshell.
East Fonthill & Port Robinson Road:
As you know, the Town has been planning for growth and development in the East Fonthill area for several years. This area includes +450 acres from Regional Road 20 and south along Rice Road, past Merritt Road. The area could accommodate 5,000 people over the next 20-25 years and includes significant commercial / mixed use lands along Hwy 20. Council insists on a great development that is walkable, cyclable, fully integrated to Downtown Fonthill and existing neighbourhoods, and adds to our small-town feel. The Town will reconstruct Port Robinson Road from Station Street to Rice Road next summer and will begin constructing services and internal roads in late-summer / early-fall.
I look forward to working together with you on these and many other improvements in 2014.
“Uptown Fonthill” Reconstruction:
Regional Council’s 2014 Capital Budget includes $4.0 million (including nearly $1 million from the Town) to reconstruct Regional Road 20 from Peachtree Park to Lookout Street, and to reconstruct Haist Street from Canboro Road to RR20. The works will include adding bikelanes, adding new sidewalks, upgrading the watermain, road reconstruction (including a turning lane to Haist Street North), and a new traffic signal. Regional staff hopes to begin work in early-spring and be done in early-September. Because of significant developments between Haist and Lookout on Hwy 20, I refer to this area as “Uptown Fonthill.”
Downtown Fenwick Revitalization:
While Council budgeted funds to revitalize Downtown Fenwick in 2013, staff ran into delays with design, with added work (storm sewer to Church Street) and with utilities. In 2014 we budgeted $4.0 million to reconstruct the roads, bury the hydro lines, and make the Downtown more pedestrian friendly. The consulting engineers will meet with the public on December 19 to review the final design with the hope that work can begin in early-spring. Council directed staff to ensure as little negative impact on Downtown businesses as possible.Peace Park:
Council earmarked funds to landscape and improve Peace Park so that the overwhelming success of the Fonthill Bandshell, the Farmer's Market, and Summerfest can grow. The plan includes tiered seating (for lawn chairs) around the Bandshell, fully-accessible internal pathways, enhancing the cenotaph, and opening-up the park for more multi-use activities. Council directed staff to ensure these improvements do not interfere with the June start of the Bandshell.East Fonthill & Port Robinson Road:
As you know, the Town has been planning for growth and development in the East Fonthill area for several years. This area includes +450 acres from Regional Road 20 and south along Rice Road, past Merritt Road. The area could accommodate 5,000 people over the next 20-25 years and includes significant commercial / mixed use lands along Hwy 20. Council insists on a great development that is walkable, cyclable, fully integrated to Downtown Fonthill and existing neighbourhoods, and adds to our small-town feel. The Town will reconstruct Port Robinson Road from Station Street to Rice Road next summer and will begin constructing services and internal roads in late-summer / early-fall.
I look forward to working together with you on these and many other improvements in 2014.
Monday, October 21, 2013
Final ANSI Boundary Protects Fonthill Kame!
I was jubilant when I received the letter and the map.
After nearly four-and-a-half years, the Ministry of Natural Resources recently issued the final ANSI (Area of Natural & Scientific Interest) boundaries for the Fonthill Kame-Delta. This final ANSI boundary includes most of the former area and increases the protection from 930 acres to 993 acres.
You will recall that the “Fonthill Kame-Delta” is our rare, 75-metre-tall landmark that was formed by retreating glaciers 13,000 years ago. The Kame boasts the highest point in Niagara and the headwaters of Twelve Mile Creek. It’s the “hill” in Fonthill and Shorthills and the “ridge” in Ridgeville. The Kame’s microclimatic and soil conditions create an ideal environment for tender fruit production.
MNR identified the Fonthill Kame as provincially significant in 1976 and as a Provincial ANSI in 1988. This designation restricts development for reasons of heritage, science or education.
In May 2009, MNR recommended significantly reducing the ANSI’s coverage to “representative samples.” Pelham Council, Niagara Regional Council, Niagara Escarpment Commission, Niagara Peninsula Conservation Authority, scientific experts, dozens of Pelham residents, Tim Hudak, MPP, and Minister Jim Bradley, St. Catharines MPP, voiced opposition to these changes.
As a result, in early 2010, Pelham received a strong commitment from Donna Cansfield, MPP, Minister of Natural Resources: “Please let me assure you that it is our intention to maintain and, where feasible, enhance the current ANSI boundary.”
Despite that assurance, in 2011, MNR proposed reducing the ANSI to “Swiss-cheese” by failing to protect huge portions of the Kame – especially those areas that are under direct threat of new or expanded development. Again we expressed our significant concerns.
In June 2013, MNR informed Council about proposed improvements to the ANSI boundaries and the plans to expand the ANSI. Both Pelham and Regional Councils acknowledged these 2013 improvements but sought MNR’s rationale for not including the entire Kame.
In their letter, MNR clarified that the parts of the Kame not included in the new ANSI boundaries “…have been extensively disturbed or impacted by various land uses and development.” The two major areas now excluded are the Chestnut Ridge subdivision and the Lafarge Pit.
To better preserve the ANSI area, MNR suggests that the Town and Region incorporate the new ANSI boundaries in municipal planning policies and in all planning decisions moving forward.
I believe that these protections are great news for Pelham and the Region! I appreciate MNR living up to the goal of maintaining and enhancing the former ANSI boundary.
In the past I have asked you to write to the Minister to encourage ANSI protection; now, I invite you to write to Minister Orazetti and thank MNR for protecting the Fonthill Kame:
Hon. David Orazietti, MPP
Minister of Natural Resources
Whitney Block, 6th Floor, Room 6630
99 Wellesley St. West
Toronto ON M7A1W3
minister.mnr@ontario.ca
Please click here for a copy of the Ministry of Natural Resources letter and a map of the final boundaries.
Monday, August 26, 2013
Making Pelham More Walkable & Cyclable This Fall
Some imminent construction will not only improve roads but will also make the Town even more walkable and cyclable.
Port Robinson Road:
The Town will reconstruct Port Robinson Road from Pelham Street to Station Street including repairing some sewer sections, and replacing water lines and storm-sewers this fall. The rebuilt road will include bike lanes and parallel parking along the School. Finally, we will reconstruct and add sidewalks on both sides of the road and re-align the Steve Bauer Trail entrance to match Station Street. (While the Town awarded the contract in June to try to complete this work prior to the restart of school, an MOE approval, the surprise location of a gas-line, and the contractor’s schedule added to the project’s timeline.)
Pelham Street:
You will recall that while Council earmarked $2.5 million for reconstructing Pelham Street from College Street to Quaker Road, the estimate came back at $6.5 million. We did apply for special Provincial funding in January (thanks to the Glynn A. Green School community, the PBA, the Chamber, and all others who wrote letters of support!), but learned we were unsuccessful in the spring. Perhaps we can apply under a new, $100 million Provincial program this fall.
In the meantime, the Town will construct a new sidewalk on the west-side of Pelham Street from Pancake Lane to Brock / Port Robinson Road this fall.
What about the idea of a traffic signal at Pancake? Installing a complete traffic signal did not meet the Ministry of Transportation’s “warrants” but did meet some opposition from local residents. Following the successful use of the Creative Problem Solving Process, Council recently approved the installation of pedestrian-priority traffic signals (like that on Haist Street at A.K. Wigg School) at Pancake Lane / John Street and at Spruceside Crescent / Bacon Lane this fall. We will also paint reduced lane widths as an attempt to lower vehicle speeds and to provide more room for cyclists.
Regional Road #20:
The Region will be constructing a special storm-sewer outlet from Regional Road 20 through Marlene Stewart-Streit Park this fall. Town Council recently approved reallocating some savings from this project so that we can add sidewalks along both sides of “Old Hwy 20” from Park Lane to Pinecrest and from Canboro Road to Church Hill. The Region will also resurface the road in that area.
And, did you notice the new school-zone lights on Regional Road #20 around St. Alexander School? Please watch for their activation next week during student’s morning and afternoon walks to school.
Pelham Town Square and Church Hill:
The Town will also reconstruct the sidewalk on the south-side of Pelham Town Square from Station Street to the Post Office and install a pedestrian-priority traffic signal at Church Hill across Pelham Street this fall.
Please be assured that Council and I continue to strive in making Pelham even more walkable and cyclable.
Subscribe to:
Posts (Atom)